Tuesday, November 10, 2009

S&P 500 1100 is a Foregone Conclusion. Then Comes the Correction.

Forget what the pundits saying. These guys don't have the capacity to take a step back and look at the long term trends of the market. They're too focused on "breaking news" that almost always has a short and unsustainable effect of stock prices. To beat the market, we have to look at long term trends that we can play. We have to anticipate market moves. The only way to do that is to look at long term patterns.
If we do take a step back and look at the S&P 500 we see a very strong bullish chart for week.


We can see that about a week into every rally in the past three months, there has been a short market breather before increased gains. We have hit that stall. Wait a couple days, and the S&P will be back in the green. As the resistance trend shows, it will top 1,100 test at around 1,115. That's when we should get very bearish. The obvious reason being that the 500 have consistently tested that resistance line, and the index has consistently failed.
Let's zoom out.


There is no reason to expect the S&P to break resistance at 1,100 for more that a very short time. We have seen in the past, that when faced with a macro resistance level, the S&P first corrects downward (circled), and then snaps back up and through the resistance line. If, after the current rally, the S&P fails to bounce off the support I illustrated in the 3 month chart, I would make the call to stay short and wait for the correction.

Good Luck,
Samba

No Need to Panic... Yet.

Today's rather frustrating market is just a manifestation of a pattern that we've seen over the past few months. Here's a three month snap shot of the Dow Industrial Average.


Durring every up trend, we can see that there is a small premature sell off and market stall made probably by profit takers who don't know how to read charts. And every time, the market bounces back and hits resistance.
This is no time to sell, and if anything, we should be buying strong positions that we already hold or otherwise.
Be careful though! We are getting close to the peak of this secondary move. Bull runs can't last forever in the short term, so get ready to pull the sell trigger in the coming weeks. If you do now though, you're going to be missing out on some more profits.
Good Luck,
Samba

Monday, November 9, 2009

My Take: Should You Rebuy Your Losing Positions?

I've heard a few people talking about this strategy of buying up more of your losers. Some people say that an investor should take as little loss as possible, while others contest that one should buy up their positions as they go down to maximize profits.
I think both views are rooted in logic, and common sense. However, neither should be thought of as "law."
Let's take the first view: You should sell your positions once they become losers. The word "losers" is arbitrary. For instance, my friend has just started a hedge fund and is trying to build a track record. At his fund, they define a loser as a position that has moved -.6% or more. They are required to sell at that point. This is due to their strict time constraints and need for absoloute maximized performance. These hedge funds usually have many more "losers" than winners, yet they are still profitable because of how they ride out their wins and quickly kill their losses - a viable strategy (and an extremely profitable one!).
Investors who are in it for the long term usually consider losers, stocks that move down over 10%. This is because bullish measured moves (also known as corrections) are generally no greater than 10%. More than that, and the risk of a primary trend reversal is much greater, so naturally one should sell that position.

Let's take a look at the second view, which is that when a position's price moves down, one should buy more of that position. It's general Dow Theory that an investor should never buy into weakness. However, I believe this is misinterpreted by proponents of the first strategy. "Weakness" is not a measured move down, or a drop in price. "Weakness" is in fact a downward, or flat primary trend. I'm a big fan of technical analysis, so let's take a look at a chart.
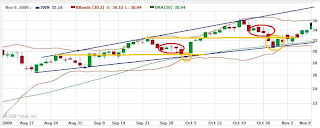


Here's one of my favorite stocks of the last couple months, just because of it's predictable moves (and we love predictability), and strong fundamentals. The blue lines are obviously the support and resistance lines. In retrospect, it's easy to see the trend, but in the moment, you might use previous resistance as current support, assuming that there was indeed a confirmed break through - those are the orange lines. The red circles are where the stock tests its new supoort line. This is the time that most investors (including myself) would buy, not wanting to miss a bounce off support. the orange cercles indicate the OPTIMAL time to buy when the price tests the primary trend support rather than the secondary movement support.
Now if you subscribe to the theory that a loser is a loser, you would either sell the stock or simply hold on to it, the second option obviously being the better one. If you know the company has good fundamentals, if you know your Dow theory, and if you see that the primary stock movement is up, you double down right there at primary support and you make bank.

Now please, don't get me wrong. BOTH strategies are viable in my opinion. Depending on your investment style, the stock, and how much pain you're willing to take on, you might want to go with one or the other. For instance, if you can make a lot of trades, and for some reason are often fully invested you probably want to go with the first strategy.
If on the other hand, you keep part of your portfolio in cash, and have to be more confident with each pick you make, you probably want to go with the second strategy.
Or, you might want to use a mix of the two.
The only thing that would be wrong would be to say that one of these strategies is always right or always wrong.

I'm here to learn, and I always appreciate different and opposing views, so write if you like.
Good Luck,
Samba

Altria: One of the Most Bullish Charts I've Seen This Month


What jumps out to me here is that wonderfully bullish and obvious Rising Triangle. This indicates accumulation in the stock and a strong continuation in the chart. There has also already been a measured move down in the recent past, which is bullish, and it protects us from a short term pull back.
Based on chart alone, I can't say it's a buy, but get on your horse and make sure there aren't any fundamental problems with this stock. We can't wait for a pull back because support is now so close to resistance. This thing could go at any time.
Comment if you know about the fundamentals. This is just a chart that struck me as very bullish.
Good Luck,
Samba

How do we play Ford?

Movers like Ford Motor Company (Public, NYSE:F) scare the crap out of me. It seems crazy for a company to move so fast in such a short time. I want to mazimize my profits, but at the same time, I don't want to get burned by a correction. I like to buy on small fluctuations. I look for a company that has strong support and I like to play reactive rallies. Let's take a look at Ford.


We see in September, a confirmed trend change in the chart, as Ford broke through its down sloping resistance (which is initially the reason I liked it). Now however, the company is nearing its new resistance at just over eight dollars. There's no reason to bank on a break in resistance because we can see that on past tests, the line held. I know earnings were strong, but I think investors expected that. I certainly expected Ford to have a great quarter, so if even I know something, you know that big boys have known it for a LOOOONG time. It's already factored into the price.
That being said, I think Ford is a SELL as of now because of resistance (I'm actually looking at the real time bids right now, and nobody is going over $8.07). At the same time, keep a look out for it in about a week to two weeks when it drops and tests support. Given that Ford is such a strong company, and in such good position for the recovery in America, it will soon be a STONG BUY. And that's what we do. Sell at resistance and buy at support.
Enjoy this maret while it lasts and don't forget to TAKE PROFITS.
Good Luck,
Samba

Friday, November 6, 2009

Taking a look at Puda Coal

Puda Coal Inc. (Public, AMEX:PUDA) "is a supplier of metallurgical coking coal to the industrial sector in the People’s Republic of China. The Company’s processed coking coal is primarily purchased by coke and steel producers for the purpose of making the coke required for the steel manufacturing process."
Puda Coal is a great play on the Chinese recovery. We know that the industrial sector is very cylical, and steel production is generally a great way to play any recovery. I don't like US steel companies yet because of this latest job number, but the Chinese recover seems to be expidited by aggressive government action.
Let's take a look at Puda Coal's chart:


This is a chart from Yahoo Finance

We see the obvious upward trend of support. At the same time, there is a slight rising wedge, as the resistance gets closer to support, but as it stands, a reversal shouldnt manifest for a couple months at least. The stock is coming off a bounce on the support line. Also, the arrows are where the generally bullish volatility pinches have occured. We can see that after each pinch, there is a significant pop in the stock.
These are classic examples of bullish technicalls.

But of course, we can't look at technicals alone. Puda Coal has positive EPS and a relatively cheap P/E ratio.
What initally interested me in this stock was actually Warren Buffet's buy of Burlington Northern Santa Fe Corporation (Public, NYSE:BNI). Yes, it was a bet on the US long term. However, the consensus seems to be that Buffet is betting on the Chinese recovery with his buy of BNI. I was looking for a recovery stock with lots of room to grow. I'm confident Puda Coal's tiny 110M market cap is going to grow quickly, especially because of its consolidation of eight Chinese coal mines, just over a month ago.


I still like Ford Ford Motor Company (Public, NYSE:F), and Nordstrom, Inc. (Public, NYSE:JWN).
Also, I covered my shorts of CIT Group Inc. (Public, NYSE:CITGQ) on Friday, and I think that's what most investors will be doing in the next few days. If you're looking at a quick profit, take a gander at CITGQ. I would never "recommend" such a terrible company, but it's worth a look.
Good Luck,
Samba