Last night, I decided to write a simple program that would calculate a stock's past EPS growth rate, and take into account current EPS, average P/E, and some other fields, and spit out an apoximated rate of return and a price that would represent the stocks dollar value a decade from now.
I'd been doing the calculation the old fashioned way, and finally decided to expedite the proecess with a program. Generally, we like stocks that can give us above a 14% annual compounded rate of return not including dividends. Here are some of the results:
Microsoft Corporation (Public, NASDAQ:MSFT)
year 1.........EPS: 1.74
year 2.........EPS: 1.97
year 3.........EPS: 2.22
year 4.........EPS: 2.51
year 5.........EPS: 2.84
year 6.........EPS: 3.21
year 7.........EPS: 3.62
year 8.........EPS: 4.09
year 9.........EPS: 4.63
year 10........EPS: 5.23
Estimated price a decade from now given past growth rate: $102
The estimated annual rate of return (no dividends) compounded is 13.0%
Nordstrom, Inc. (Public, NYSE:JWN)
year 1.........EPS: 1.81
year 2.........EPS: 2.12
year 3.........EPS: 2.48
year 4.........EPS: 2.9
year 5.........EPS: 3.4
year 6.........EPS: 3.98
year 7.........EPS: 4.65
year 8.........EPS: 5.44
year 9.........EPS: 6.37
year 10........EPS: 7.45
Estimated price a decade from now given past growth rate: $156
The estimated annual rate of return (no dividends) compounded is 16.2%
The Coca-Cola Company (Public, NYSE:KO)
year 1.........EPS: 2.97
year 2.........EPS: 3.27
year 3.........EPS: 3.59
year 4.........EPS: 3.95
year 5.........EPS: 4.35
year 6.........EPS: 4.78
year 7.........EPS: 5.26
year 8.........EPS: 5.79
year 9.........EPS: 6.37
year 10........EPS: 7.0
Estimated price a decade from now given past growth rate: $119
The estimated annual rate of return (no dividends) compounded is 7.7%
Caterpillar Inc. (Public, NYSE:CAT)
year 1.........EPS: 2.41
year 2.........EPS: 2.72
year 3.........EPS: 3.07
year 4.........EPS: 3.47
year 5.........EPS: 3.92
year 6.........EPS: 4.43
year 7.........EPS: 5.01
year 8.........EPS: 5.66
year 9.........EPS: 6.4
year 10........EPS: 7.23
Estimated price a decade from now given past growth rate: $181
The estimated annual rate of return (no dividends) compounded is 11.8%
International Business Machines Corp. (Public, NYSE:IBM)
year 1.........EPS: 11.65
year 2.........EPS: 13.98
year 3.........EPS: 16.78
year 4.........EPS: 20.13
year 5.........EPS: 24.16
year 6.........EPS: 28.99
year 7.........EPS: 34.79
year 8.........EPS: 41.75
year 9.........EPS: 50.1
year 10........EPS: 60.12
Estimated price a decade from now given past growth rate: $782
The estimated annual rate of return (no dividends) compounded is 19.8%
Remember now, these are just estimates, and by no means should you go out and buy a stock just because it's supposed to have a good rate of return. In fact, I can say with a fair ammount of certainty, that IBM will not be able to keep up it's pace over the next decade. The last bubble and recession skewed the data slightly, and don't even TRY to estimate the rate of return for banks like BAC and Citi. Nor should you trust it's results for new faces like Apple Inc. (Public, NASDAQ:AAPL), or Google Inc. (Public, NASDAQ:GOOG), as you'll get ridiculous growth rates.
All that being said, a prudent investor should always try and make their decisions devoid of emotion. This is a nice little screen if you want to invest LONG TERM in WELL KNOWN, LARGE CAP companies.
Remember to use diligence on all your picks. Comment or find me on twitter ("SambaStocks") if you want to request that I post any other results. I'll also post more periodically.
Good Luck,
Samba
Showing posts with label Market Strategy. Show all posts
Showing posts with label Market Strategy. Show all posts
Wednesday, November 18, 2009

Monday, November 9, 2009
My Take: Should You Rebuy Your Losing Positions?
I've heard a few people talking about this strategy of buying up more of your losers. Some people say that an investor should take as little loss as possible, while others contest that one should buy up their positions as they go down to maximize profits.
I think both views are rooted in logic, and common sense. However, neither should be thought of as "law."
Let's take the first view: You should sell your positions once they become losers. The word "losers" is arbitrary. For instance, my friend has just started a hedge fund and is trying to build a track record. At his fund, they define a loser as a position that has moved -.6% or more. They are required to sell at that point. This is due to their strict time constraints and need for absoloute maximized performance. These hedge funds usually have many more "losers" than winners, yet they are still profitable because of how they ride out their wins and quickly kill their losses - a viable strategy (and an extremely profitable one!).
Investors who are in it for the long term usually consider losers, stocks that move down over 10%. This is because bullish measured moves (also known as corrections) are generally no greater than 10%. More than that, and the risk of a primary trend reversal is much greater, so naturally one should sell that position.
Let's take a look at the second view, which is that when a position's price moves down, one should buy more of that position. It's general Dow Theory that an investor should never buy into weakness. However, I believe this is misinterpreted by proponents of the first strategy. "Weakness" is not a measured move down, or a drop in price. "Weakness" is in fact a downward, or flat primary trend. I'm a big fan of technical analysis, so let's take a look at a chart.
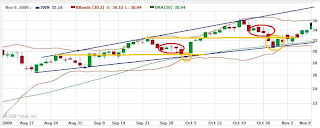
Here's one of my favorite stocks of the last couple months, just because of it's predictable moves (and we love predictability), and strong fundamentals. The blue lines are obviously the support and resistance lines. In retrospect, it's easy to see the trend, but in the moment, you might use previous resistance as current support, assuming that there was indeed a confirmed break through - those are the orange lines. The red circles are where the stock tests its new supoort line. This is the time that most investors (including myself) would buy, not wanting to miss a bounce off support. the orange cercles indicate the OPTIMAL time to buy when the price tests the primary trend support rather than the secondary movement support.
Now if you subscribe to the theory that a loser is a loser, you would either sell the stock or simply hold on to it, the second option obviously being the better one. If you know the company has good fundamentals, if you know your Dow theory, and if you see that the primary stock movement is up, you double down right there at primary support and you make bank.
Now please, don't get me wrong. BOTH strategies are viable in my opinion. Depending on your investment style, the stock, and how much pain you're willing to take on, you might want to go with one or the other. For instance, if you can make a lot of trades, and for some reason are often fully invested you probably want to go with the first strategy.
If on the other hand, you keep part of your portfolio in cash, and have to be more confident with each pick you make, you probably want to go with the second strategy.
Or, you might want to use a mix of the two.
The only thing that would be wrong would be to say that one of these strategies is always right or always wrong.
I'm here to learn, and I always appreciate different and opposing views, so write if you like.
Good Luck,
Samba
I think both views are rooted in logic, and common sense. However, neither should be thought of as "law."
Let's take the first view: You should sell your positions once they become losers. The word "losers" is arbitrary. For instance, my friend has just started a hedge fund and is trying to build a track record. At his fund, they define a loser as a position that has moved -.6% or more. They are required to sell at that point. This is due to their strict time constraints and need for absoloute maximized performance. These hedge funds usually have many more "losers" than winners, yet they are still profitable because of how they ride out their wins and quickly kill their losses - a viable strategy (and an extremely profitable one!).
Investors who are in it for the long term usually consider losers, stocks that move down over 10%. This is because bullish measured moves (also known as corrections) are generally no greater than 10%. More than that, and the risk of a primary trend reversal is much greater, so naturally one should sell that position.
Let's take a look at the second view, which is that when a position's price moves down, one should buy more of that position. It's general Dow Theory that an investor should never buy into weakness. However, I believe this is misinterpreted by proponents of the first strategy. "Weakness" is not a measured move down, or a drop in price. "Weakness" is in fact a downward, or flat primary trend. I'm a big fan of technical analysis, so let's take a look at a chart.

Here's one of my favorite stocks of the last couple months, just because of it's predictable moves (and we love predictability), and strong fundamentals. The blue lines are obviously the support and resistance lines. In retrospect, it's easy to see the trend, but in the moment, you might use previous resistance as current support, assuming that there was indeed a confirmed break through - those are the orange lines. The red circles are where the stock tests its new supoort line. This is the time that most investors (including myself) would buy, not wanting to miss a bounce off support. the orange cercles indicate the OPTIMAL time to buy when the price tests the primary trend support rather than the secondary movement support.
Now if you subscribe to the theory that a loser is a loser, you would either sell the stock or simply hold on to it, the second option obviously being the better one. If you know the company has good fundamentals, if you know your Dow theory, and if you see that the primary stock movement is up, you double down right there at primary support and you make bank.
Now please, don't get me wrong. BOTH strategies are viable in my opinion. Depending on your investment style, the stock, and how much pain you're willing to take on, you might want to go with one or the other. For instance, if you can make a lot of trades, and for some reason are often fully invested you probably want to go with the first strategy.
If on the other hand, you keep part of your portfolio in cash, and have to be more confident with each pick you make, you probably want to go with the second strategy.
Or, you might want to use a mix of the two.
The only thing that would be wrong would be to say that one of these strategies is always right or always wrong.
I'm here to learn, and I always appreciate different and opposing views, so write if you like.
Good Luck,
Samba
Subscribe to:
Posts (Atom)